La population de Chamborand a été estimée à 235 habitants en 2007. Vous trouverez ci-dessous un ensemble de graphiques courbes et statistiques du recensement de la population du village de Chamborand.
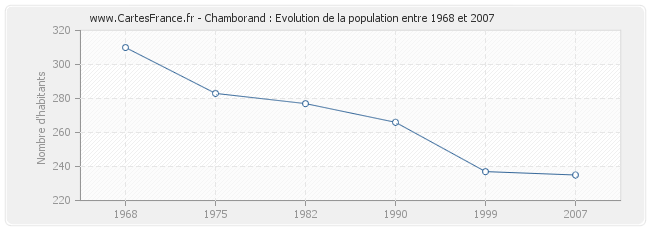
La population de Chamborand était de 237 habitants en 1999, 266 habitants en 1990, 277 habitants en 1982, 283 habitants en 1975 et 310 habitants en 1968.
Chamborand à une surperficie de 11,18 km², soit une densité de population de 21,02 habs/km².
Voir la population des villes et villages proches de Chamborand :
- Population de Saint-Étienne-de-Fursac (23) situé à 4.67 km de Chamborand
- Population de Saint-Pierre-de-Fursac (23) situé à 4.70 km de Chamborand
- Population de Le Grand-Bourg (23) situé à 5.45 km de Chamborand
- Population de Saint-Priest-la-Plaine (23) situé à 5.66 km de Chamborand
- Population de Saint-Priest-la-Feuille (23) situé à 5.77 km de Chamborand
Voir la population de la préfecture du département de la Creuse : Population Guéret
Voir la population des autres villes de la Creuse : Creuse
A voir aussi, les logements de Chamborand, les photos de Chamborand, le plan de Chamborand.
J'aime Chamborand !
Historique de la population de Chamborand de 1968 à 2007
Historique de la population de Chamborand de 1968 à 2007 :
La population de Chamborand était de 235 habitants en 2007, 237 habitants en 1999, 266 habitants en 1990, 277 habitants en 1982, 283 habitants en 1975 et 310 habitants en 1968.
Ce recensement de la population du village de Chamborand est sans doubles comptes.
Ce concept de population de Chamborand sans doubles comptes signifie que chaque personne habitant Chamborand et ayant des attaches dans un autre commune n'est prise en compte que pour l'une de ces deux communes.
Population Chamborand
Répartition de la population de Chamborand par sexe
Répartition de la population de Chamborand par sexe :
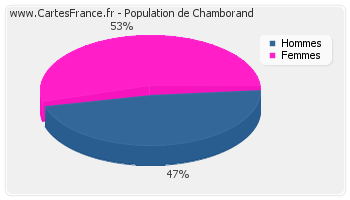
- Le nombre d'hommes habitant Chamborand en 2007 était de 109
- Le nombre de femmes habitant Chamborand en 2007 était de 125
- Le nombre d'hommes habitant Chamborand en 2007 était de 109
- Le nombre de femmes habitant Chamborand en 2007 était de 125

Evolution de la population de Chamborand
Population de Chamborand de 1968 à 2007 :
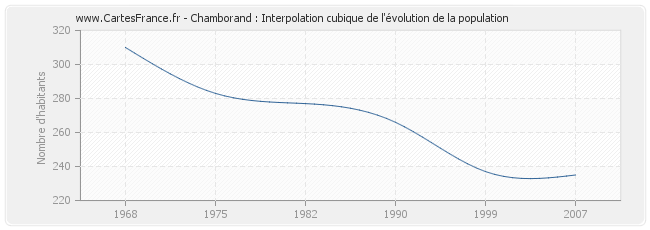
Cette courbe reprend l'historique de la population de Chamborand de 1968 à 2007 en interpolation cubique. Ceci permet d'obtenir plus précisément la population de la commune de Chamborand les années ou aucun recensement n'a été effectué.
- Population de Chamborand en 2007 : 235 habitants
- Population de Chamborand en 1999 : 237 habitants
- Population de Chamborand en 1990 : 266 habitants
- Population de Chamborand en 1982 : 277 habitants
- Population de Chamborand en 1975 : 283 habitants
- Population de Chamborand en 1968 : 310 habitants
Chamborand : naissances et décès
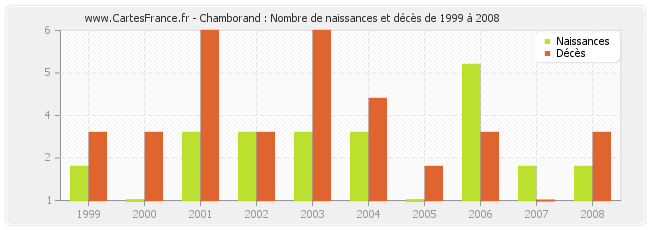
Chamborand : naissances et décès de 1999 à 2008
- Chamborand en 2008 : 2 naissances et 3 décès
- Chamborand en 2007 : 2 naissances et 1 décès
- Chamborand en 2006 : 5 naissances et 3 décès
- Chamborand en 2005 : 1 naissances et 2 décès
- Chamborand en 2004 : 3 naissances et 4 décès
- Chamborand en 2003 : 3 naissances et 6 décès
- Chamborand en 2002 : 3 naissances et 3 décès
- Chamborand en 2001 : 3 naissances et 6 décès
- Chamborand en 2000 : 1 naissances et 3 décès
- Chamborand en 1999 : 2 naissances et 3 décès
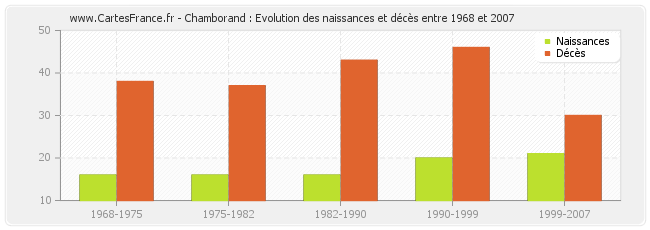
Chamborand : évolution des naissances et décès de 1968 à 2007
- De 1999 à 2007 : 21 naissances et 30 décès
- De 1990 à 1999 : 20 naissances et 46 décès
- De 1982 à 1990 : 16 naissances et 43 décès
- De 1975 à 1982 : 16 naissances et 37 décès
- De 1968 à 1975 : 16 naissances et 38 décès
Répartition de la population de Chamborand par âge
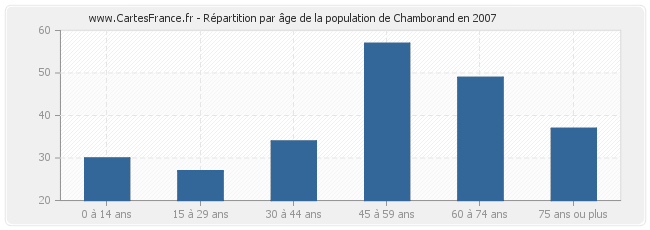
Répartition de la population de Chamborand par âge en 2007 :
- Population de Chamborand de 0 à 14 ans : 30 habitants
- Population de Chamborand de 15 à 29 ans : 27 habitants
- Population de Chamborand de 30 à 44 ans : 34 habitants
- Population de Chamborand de 45 à 59 ans : 57 habitants
- Population de Chamborand de 60 à 74 ans : 49 habitants
- Population de Chamborand de 75 ans ou plus : 37 habitants
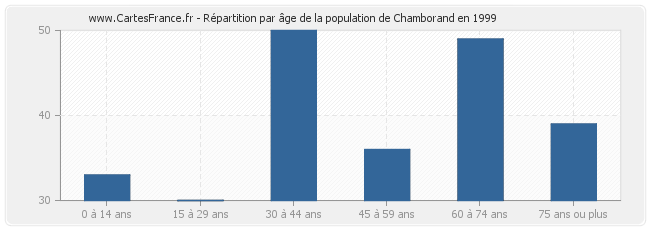
Répartition de la population de Chamborand par âge en 1999 :
- Population de Chamborand de 0 à 14 ans : 33 habitants
- Population de Chamborand de 15 à 29 ans : 30 habitants
- Population de Chamborand de 30 à 44 ans : 50 habitants
- Population de Chamborand de 45 à 59 ans : 36 habitants
- Population de Chamborand de 60 à 74 ans : 49 habitants
- Population de Chamborand de 75 ans ou plus : 39 habitants
Population masculine de Chamborand en 2007
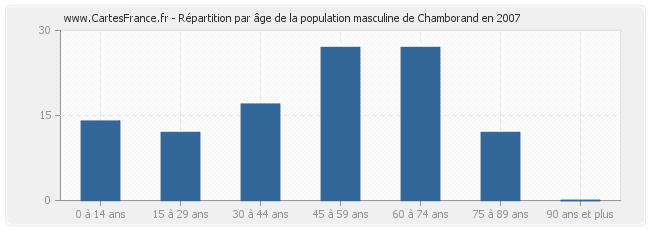
Répartition de la population masculine de Chamborand par âge en 2007 :
- Hommes de 0 à 14 ans habitant Chamborand : 14
- Hommes de 15 à 29 ans habitant Chamborand : 12
- Hommes de 30 à 44 ans habitant Chamborand : 17
- Hommes de 45 à 59 ans habitant Chamborand : 27
- Hommes de 60 à 74 ans habitant Chamborand : 27
- Hommes de 75 à 90 ans habitant Chamborand : 12
- Hommes de 90 ans ou plus habitant Chamborand : 0
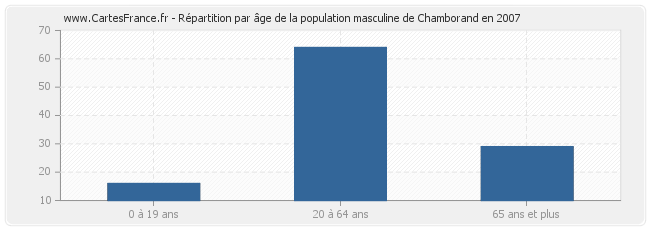
Répartition de la population masculine de Chamborand par âge en 2007 :
- Hommes de 0 à 19 ans habitant Chamborand : 16
- Hommes de 20 à 64 ans habitant Chamborand : 64
- Hommes de 65 ans et plus habitant Chamborand : 29
Population féminine de Chamborand en 2007
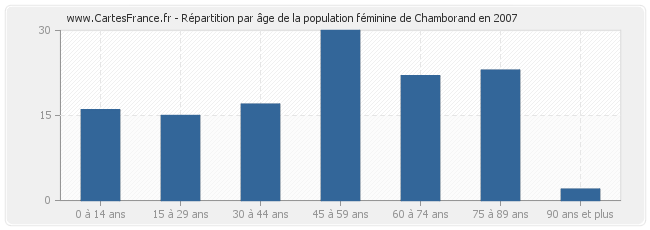
Répartition de la population féminine de Chamborand par âge en 2007 :
- Femmes de 0 à 14 ans habitant Chamborand : 16
- Femmes de 15 à 29 ans habitant Chamborand : 15
- Femmes de 30 à 44 ans habitant Chamborand : 17
- Femmes de 45 à 59 ans habitant Chamborand : 30
- Femmes de 60 à 74 ans habitant Chamborand : 22
- Femmes de 75 à 90 ans habitant Chamborand : 23
- Femmes de 90 ans ou plus habitant Chamborand : 2
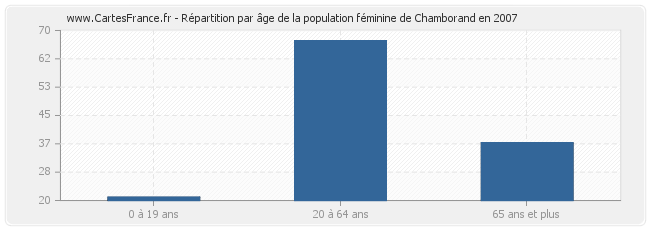
Répartition de la population féminine de Chamborand par âge en 2007 :
- Femmes de 0 à 19 ans habitant Chamborand : 21
- Femmes de 20 à 64 ans habitant Chamborand : 67
- Femmes de 65 ans et plus habitant Chamborand : 37
